

Match Overview
The Golden State Warriors vs Dallas Mavericks match player stats from March 23, 2026, tell the story of a thrilling regular-season contest that required overtime to decide the winner. Golden State defeated Dallas 137–131 at the American Airlines Center, earning a hard-fought victory in a high-scoring game. Both teams produced strong individual performances, but the Warriors found enough scoring across their lineup to outlast the Mavericks when the pressure increased.
Cooper Flagg led Dallas with 32 points and nine assists, delivering one of the game’s most productive performances. Moses Moody paced Golden State with 23 points, while Kristaps Porziņģis and Brandin Podziemski also contributed more than 20 points. The result highlighted the value of balanced scoring, efficient finishing, and contributions from players beyond the leading scorers. For fans reviewing the matchup, the box score offers a useful picture of how both teams competed.
Warriors vs Mavericks Box Score
The final score was Golden State Warriors 137, Dallas Mavericks 131, after overtime. The player numbers show that Dallas shot efficiently from the field, while Golden State received scoring contributions from several players. According to the available game summary, the Mavericks made 51 of 87 field-goal attempts, while the Warriors converted 51 of 101. Golden State’s greater shot volume helped offset Dallas’s stronger overall field-goal percentage.
| Team statistic | Golden State Warriors | Dallas Mavericks |
|---|---|---|
| Final score | 137 | 131 |
| Field goals | 51–101 | 51–87 |
| Field-goal percentage | 50.5% | 58.6% |
| Three-pointers | 17–47 | 16–36 |
| Three-point percentage | 36.2% | 44.4% |
| Result | Win in overtime | Loss in overtime |
These figures underline the contrast between the teams’ shooting approaches. Dallas was more accurate overall and from three-point range, but Golden State attempted more shots and had enough production from multiple players to reach 137 points. The Warriors’ three-point total also helped them remain competitive against a Mavericks lineup that converted its opportunities at a higher rate. Shooting percentages matter, but they do not explain a complete result without considering volume and the contributions of the entire rotation.
Warriors Player Stats and Top Performers
Moses Moody was Golden State’s leading scorer with 23 points in 34 minutes. He made eight of 20 field-goal attempts, including four three-pointers, and added three rebounds, three assists, three steals, and two blocks. His all-around line showed activity at both ends of the floor. Moody’s scoring gave the Warriors an important offensive option, while his defensive numbers reflected his involvement beyond putting the ball in the basket.
Porziņģis finished with 22 points, seven rebounds, and five assists, while Podziemski recorded 20 points, 10 rebounds, and six assists. Gary Payton II added 17 points on a perfect eight-for-eight shooting performance from the field. Gui Santos contributed 16 points, and LJ Cryer and Will Richard added 14 and 12 points respectively. The spread of production was important: Golden State did not rely on a single scorer to carry the offense throughout the contest.
| Warriors player | PTS | REB | AST | STL | BLK |
|---|---|---|---|---|---|
| Moses Moody | 23 | 3 | 3 | 3 | 2 |
| Kristaps Porziņģis | 22 | 7 | 5 | 1 | 0 |
| Brandin Podziemski | 20 | 10 | 6 | 1 | 1 |
| Gary Payton II | 17 | 4 | 3 | 2 | 0 |
| Gui Santos | 16 | 6 | 5 | 2 | 1 |
| LJ Cryer | 14 | 4 | 1 | 0 | 0 |
| Will Richard | 12 | 0 | 1 | 1 | 0 |
| Draymond Green | 11 | 7 | 6 | 3 | 0 |
Draymond Green scored 11 points and added seven rebounds, six assists, and three steals. His contribution reflected the playmaking and defensive work that can influence a game even when a player is not among the team’s top scorers. De’Anthony Melton did not score, but he collected six rebounds, five assists, and three steals. Those details demonstrate why a full box score is more informative than a points-only summary.
Dallas Mavericks Player Stats and Top Performers
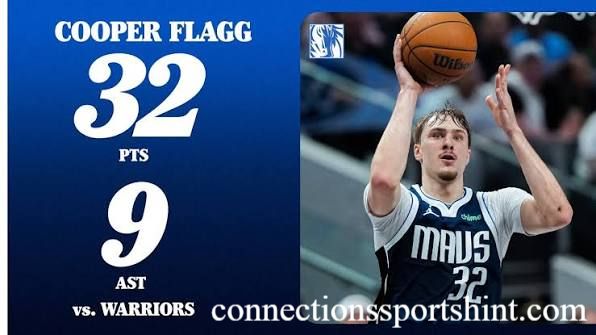
Cooper Flagg was Dallas’s standout performer, finishing with 32 points, four rebounds, and nine assists in 42 minutes. He shot 12-for-19 from the field and made six of six free throws. His scoring and passing gave the Mavericks a reliable offensive focal point, and his numbers made him the game’s highest scorer. Even with that strong individual performance, Dallas could not secure the win in overtime.
Daniel Gafford delivered an efficient 20-point performance, making all eight of his field-goal attempts and adding seven rebounds and five assists. Naji Marshall scored 16 points and distributed seven assists, while Max Christie and Klay Thompson each finished with 15 points. Thompson connected on five three-pointers, giving Dallas valuable perimeter scoring. The Mavericks had several productive contributors, but their combined effort ultimately fell short of Golden State’s overtime total.
| Mavericks player | PTS | REB | AST | STL | BLK |
|---|---|---|---|---|---|
| Cooper Flagg | 32 | 4 | 9 | 2 | 0 |
| Daniel Gafford | 20 | 7 | 5 | 1 | 1 |
| Naji Marshall | 16 | 6 | 7 | 1 | 0 |
| Max Christie | 15 | 2 | 1 | 2 | 1 |
| Klay Thompson | 15 | 1 | 1 | 1 | 1 |
| John Poulakidas | 9 | 0 | 1 | 1 | 0 |
| Marvin Bagley III | 9 | 0 | 3 | 0 | 0 |
| P.J. Washington | 9 | 3 | 2 | 3 | 0 |
Dallas also received nine points each from John Poulakidas, Marvin Bagley III, and P.J. Washington. Ryan Nembhard added five assists, while Khris Middleton recorded three assists in limited minutes. These contributions helped the Mavericks build a competitive offensive performance. However, the final score shows that productive individual lines do not always translate into victory, particularly when a close game extends beyond regulation.
Head-to-Head Player Comparison
The individual comparison highlights different strengths on each side. Flagg led all scorers with 32 points and came close to a double-digit assist total, while Moody led Golden State with 23 points and contributed five combined steals and blocks. Porziņģis and Podziemski gave the Warriors two additional 20-point scorers, with Podziemski also recording a double-double through his 10 rebounds.
| Category | Golden State leader | Dallas leader |
|---|---|---|
| Points | Moses Moody — 23 | Cooper Flagg — 32 |
| Rebounds | Brandin Podziemski — 10 | Daniel Gafford — 7 |
| Assists | Brandin Podziemski / Draymond Green — 6 each | Cooper Flagg — 9 |
| Steals | Moses Moody / Draymond Green / De’Anthony Melton — 3 each | P.J. Washington — 3 |
| Blocks | Moses Moody — 2 | Several players — 1 each |
The comparison shows why it is useful to look beyond the leading scorer. Dallas had the highest individual point total, but Golden State’s leading rebounder collected more boards than any Mavericks player listed in the available stats. The Warriors also had multiple players reach 20 points, creating a more distributed scoring profile. These differences help explain how a team can lose despite an outstanding performance from its primary offensive contributor.

Key Moments and Game-Changing Performances
The most notable feature of this matchup was the overtime finish. A 131–131 scoreline was not the final result; Golden State scored enough in the extra period to finish with 137 points and claim the win. Overtime games often magnify execution, shot selection, and composure because each possession has greater importance. The available final score confirms the close finish, although a full play-by-play account is needed to assign specific turning points to individual possessions.
Golden State’s supporting cast was a major part of the result. Payton’s eight-for-eight field-goal shooting and Richard’s four-for-four performance from three-point range stand out in the box score. Meanwhile, Dallas received efficient scoring from Gafford and five three-pointers from Thompson. Those performances kept the Mavericks competitive, but Golden State’s broader collection of scoring options helped the Warriors reach the winning total.
Team Shooting and Offensive Efficiency
The team shooting figures reveal an interesting contrast. Dallas made 58.6% of its field-goal attempts, compared with approximately 50.5% for Golden State. The Mavericks also shot 44.4% from beyond the arc, ahead of the Warriors’ 36.2%. These percentages suggest that Dallas converted a greater share of its opportunities, but the Warriors attempted 14 more field goals and made one more three-pointer in total.
Golden State’s offensive output came from both high-volume scorers and efficient role players. Moody, Porziņģis, and Podziemski all scored at least 20 points, while Payton and Richard converted every field goal they attempted. Dallas countered with Flagg’s 32 points, Gafford’s perfect field-goal shooting, and Thompson’s perimeter accuracy. The matchup is a reminder that shooting efficiency is only one part of basketball analysis; total attempts, turnovers, rebounds, and late-game execution can all influence the final result.
Rebounds, Assists, and Defense
Rebounds and assists help explain how players affect the game beyond scoring. Podziemski led the Warriors with 10 rebounds and tied for the team’s highest assist total with six, while Green also recorded six assists. For Dallas, Gafford collected seven rebounds, and Flagg led his team with nine assists. Marshall added seven assists, giving the Mavericks another important playmaker in the rotation.
Defensive statistics also reveal useful contributions. Moody, Green, and Melton each recorded three steals for Golden State, while Washington led Dallas with three steals. Moody added two blocks, and several Mavericks recorded one block apiece. Steals and blocks do not capture every defensive contribution, but they provide evidence of plays that disrupted possessions. To assess defense fully, readers should also consider defensive positioning, contested shots, switches, and team communication rather than relying on box-score totals alone.
Previous Matchup and Recent Head-to-Head Context
The teams’ January 22, 2026 meeting ended with Dallas defeating Golden State 123–115. Naji Marshall led the Mavericks with 30 points and nine assists, while Stephen Curry scored 38 points for the Warriors and made eight three-pointers. The result offered a different picture from the March meeting: Dallas won in January, but Golden State responded with a victory in the later overtime contest.
Comparing the two games shows how head-to-head results can change with lineups, player availability, shooting, and late-game execution. Curry’s scoring was central to the January matchup, while the March box score featured Moody as Golden State’s leading scorer and Flagg as Dallas’s top performer. Readers should treat each game as its own performance sample instead of assuming that one result guarantees the same outcome in a future meeting.
What the Match Stats Reveal
The Golden State Warriors vs Dallas Mavericks match player stats show that a close contest can feature very different paths to scoring. Dallas was more accurate from the field and from three-point range, while Golden State relied on a higher number of field-goal attempts and a wider spread of scoring. The Warriors had three players score at least 20 points, and several more reached double figures, reducing the pressure on any one player to produce every possession.
For readers evaluating player performance, the most useful approach is to combine points, rebounds, assists, shooting splits, and defensive numbers. Flagg’s 32 points and nine assists deserve attention, but Podziemski’s double-double, Payton’s perfect field-goal shooting, and Moody’s two-way production were also meaningful. Together, these statistics provide a fuller explanation of the 137–131 overtime result than the final score alone.
Conclusion
Golden State’s 137–131 overtime victory over Dallas on March 23, 2026, was shaped by strong contributions across the Warriors lineup and a standout performance from Cooper Flagg on the Mavericks’ side. Moody led Golden State with 23 points, while Porziņģis and Podziemski each scored at least 20. Flagg topped all players with 32 points and nine assists, but Dallas could not turn its efficient shooting into a win.
The best way to understand this matchup is to examine the complete box score rather than focusing only on the leading scorers. Points explain who finished possessions, while rebounds, assists, steals, blocks, and shooting percentages reveal how players influenced the wider contest. For fans tracking future Warriors–Mavericks meetings, these stats offer a helpful baseline for comparing performances without assuming that the same patterns will repeat.
Frequently Asked Questions
Who won the Golden State Warriors vs Dallas Mavericks game on March 23, 2026?
The Golden State Warriors defeated the Dallas Mavericks 137–131 in overtime.
Who scored the most points in the game?
Cooper Flagg led all scorers with 32 points for Dallas.
Who was Golden State’s leading scorer?
Moses Moody led the Warriors with 23 points.
Which Warriors player recorded a double-double?
Brandin Podziemski recorded 20 points and 10 rebounds.
How many points did Kristaps Porziņģis score?
Porziņģis finished with 22 points, seven rebounds, and five assists.
How did Klay Thompson perform against the Warriors?
Thompson scored 15 points and made five three-pointers for Dallas.
What was the result of the January 22, 2026 matchup?
The Mavericks defeated the Warriors 123–115, led by Naji Marshall’s 30 points and nine assists.
Where can fans check updated Warriors vs Mavericks player stats?
Fans can check official NBA game pages and reputable sports score services for box scores, player statistics, and upcoming game information.
Author Name: Hamid Ali
Email: johanharwen314@gmail.com
Also Read: